Empowering your everyday business decisions with data
Restaurants don’t have the time to create their own data reports or dig through endless numbers, so we designed Looker with the busy store operator in mind: offering quick snapshots of sales data and other critical information in interactive, easy-to-use dashboards.
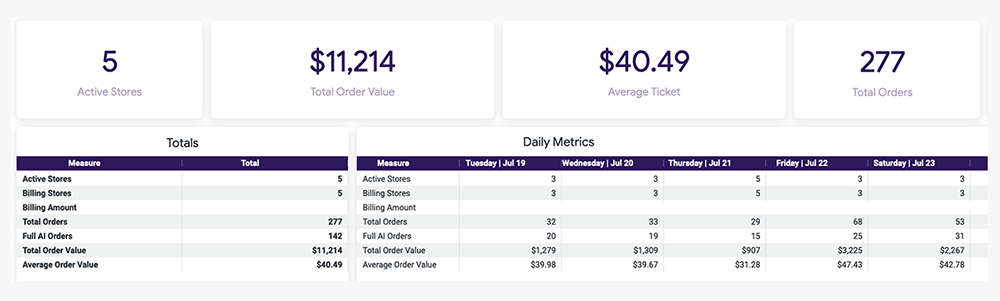
Advanced reporting
Gain critical insight on key metrics like sales, order volume and average ticket, where you can get automated reports and alerts emailed to you as frequently as you’d like
Growth monitoring
Measure and compare results over customizable time periods to unlock never-before-seen insights for boosting store performance
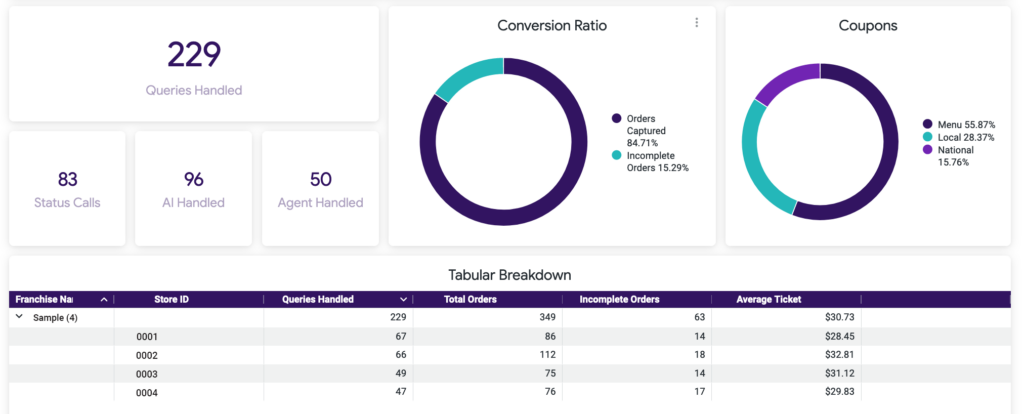
Store comparisons
Especially helpful for multi-unit owners, view data by franchise or store level to compare call volume, order conversion, coupon use and other bottom-line factors
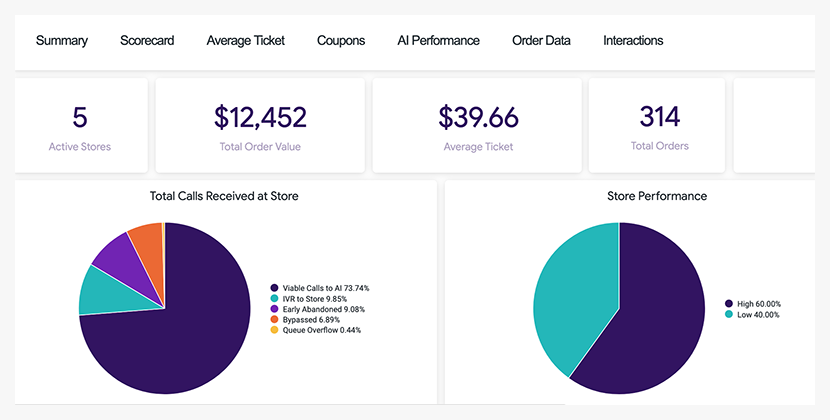
AI performance
Enjoy complete transparency in monitoring AI closure and order completion, as well as viewing any call that our virtual assistants handle for quality assurance
Unlock never before seen insights
Looker is a powerful data analytics and reporting platform that we created in partnership with Google, allowing you to unlock the everyday insights that matter to you – everything from average ticket and sales data to details about your AI performance, so you always can track the impact of our virtual ordering assistants in your store, as well as uncover key findings to improve performance beyond the scope of AI.
Looker is included in your ConverseNow experience as another example of our commitment to our partners. We believe in empowering restaurant owners and operators with the power to improve their guest experience, staff culture and overall performance, and unlocking valuable data is a critical step in achieving each of these goals.
With flexible and easy-to-use data dashboards, Looker requires no advanced tech or analytics knowledge.
Simple to use, easy to understand
We designed Looker with owners and operators in mind. If you love seeing the data but hate the idea of crunching numbers and making sense of complex tables, this should be a breath of fresh air.
Easily view performance over any time period, and customize the look and feel of any of our already-simple charts and graphs. Monitor KPI’s including
Call volume and conversion
Sales and average ticket
Order data and coupon use
AI performance and guest experience
Worried that a coupon might get overused or a store may be underperforming? Set up custom alerts to save incalculable time and energy, so you can focus other priorities like quality food and service.
See how easy it is to use your data dashboard
Curious to learn more about how Looker provides the live store data you need? Contact our Sales team here to book a demo and see Looker for yourself.